Mean stress effect
The most of the methods introduced into PragTic has either the mean stress effect (MSE) in some way firmly set or there are several options that can be chosen.
Note: A very important concept is used throughout PragTic. Whenever the evaluated mean stress is less than zero (i.e. in the push mode), it is zeroed as a default option:
![]()
The only another option currently available is that the formulas used for determination of allowable reduced amplitude of the fatigue limit f-1red or of the equivalent load amplitude ![]() are using the same pattern even for negative mean stresses. While the first option (mean stress set to zero) is surely conservative for low compressive mean stresses, the second option (leaving the formula as is) is likely to be non-conservative.
are using the same pattern even for negative mean stresses. While the first option (mean stress set to zero) is surely conservative for low compressive mean stresses, the second option (leaving the formula as is) is likely to be non-conservative.
Interesting overview reports concerning comparison of different methods can be found in [NHB86] or [Dow04].
Equivalent load amplitude
This solution is usually used by the e-N curve based methods, where the overall load effect of the mean stress and the amplitude is looked for. The most often cited is probably the solution proposed by Smith, Watson & Topper, which is well known under the acronym SWT.
SWT
This type of the MSE is used in the SWT unixial fatigue calculation method. It is defined as:
![]() .
.
Dowling [Dow04] finds this method as suitable for general use in ductile materials. It seems to be acceptable for aluminum alloys and worse than the Morrow No. 2 method for steels.
Walker
Walker further elaborates the SWT parameter by adding a new exponent ![]() :
:
![]() .
.
Thanks to the further material parameter, the method gives better results than the previous methods. In order to coincide with the SWT parameter, the exponent should become one, the real value nevertheless lie between values 0.25-0.53 ([NHB86]), where also a universal value 0.5 is proposed. The method is currently used within the Erdogan-Roberts calculation method.
Bergmann
Another clone of the SWT parameter uses other way in its modification:
![]() .
.
Again, the value k = 1 would give the SWT parameter, [NHB86] nevertheless founds real values in the region 0.4-0.7. The same report states that the application of the parameter k = 0.4 lead to the best overall results in comparison to other methods. The formula is fully utilized in the Bergmann fatigue life calculation method.
Reduction to allowable amplitude
There are several ways how to cope with the mean stress effect available. The most of them are also visualized in the figure below. The result is approached from another direction. Not the overall load effect is looked for, but the available limit curve is decreased in order to show, what will be the allowable loading under the given mean stress.
Finite life
The figure above relates to the search for the allowable fatigue limit f-1red. A more complex solution is necessary to describe also the changes in the rest of the S-N curve, if finite lifetime has to be set. The following figure should be an appropriate base for the next explanation:
Any basic S-N curve is determined by three parameters in PragTic. These are the fatigue limit f-1, slope w and number of cycles at fatigue limit Nf. The next parameter necessary is the tensile strength Su. The slope of the S-N curve allows setting the related number of cycles Nu:
 .
.
The bright blue line (Su line) joins two points [Nu, Su] and [1, 1], where the second point should be [1, 0] to better describe the reaching of the tensile strength by the mean stress with zero amplitude, but the error is insignificant while the computation and graphic representation in bi-logarithmic graph is easier.
Any other S-N curve with firmly set mean stress σm can be deduced from the reduced fatigue limit (next subsection) and the intersection of the reduced S-N curve with the bright blue line:
![]()
The only other condition is that the number of cycles of the reduced fatigue limit stays the same Nf:
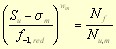 ,
,
i.e. the slope of the reduced S-N curve is:
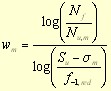
The presented solution works with several conditions that are need not to be fulfilled:
* The number of cycles at fatigue limit stays the same, no matter how big is the mean stress
* The S-N curve is bilogarithmic within the whole range up to fatigue limit. This is generally untrue and a break somewhere near 1000 cycles can be seen often.
* The existence of the bilogarithmic bright blue Su line is a mere mathematical apparatus.
Nevertheless, the same solution is also used in FemFat [ECS4.4]. FemFat at last shifts also the number of cycles at fatigue limit to lower values, but only after the previous two parameters of the S-N curve (the fatigue limit and the slope) were set:
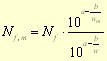 .
.
The parameters a and b are fixed in dependency on the sorting of the material to a material group. While [ECS4.4] states a=6.8 and b=3.6 for steels and a=6.4 and b=2.5 for other materials, [ECS4.7] leaves a=6.8 and b=3.6 for cast steels only. PragTic applies the first choice set in [ECS4.4] as default parameters as they are the more conservative ones.
In fact, it is not clear, why the parameter a stays in the equation, because it can be easily removed from the fraction by division. Thus only the b parameter is active in the calculations in PragTic under the description N_MSE. Note please that the number of cycles at the reduced fatigue limit is not decreased at all if N_MSE = 0, i.e. the last equation is not effective in such a case.
The following computational schemes are available:
No
No special coverage of the MSE is expected. The mean stress effect should be already implemented in the core of the fatigue calculation method or the applied loading is alternate (applied mean stress being zero).
Goodman
The basic formula states:
![]() ,
,
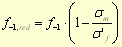
which in the search for allowable load amplitude results in the following formula:
 .
.
Dowling in [Dow04] states the main usability of the formula for ductile materials.
Gerber
The general opinion is that the Gerber's formula forms the other border to the Goodman formula, this time relating to the non-conservative side. The real result should lie somewhere between these two lines for ductile materials. The line in the figure above is defined as:
 ,
,
which results in the following formula:
 .
.
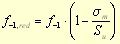
Soderberg
The Soderberg solution is focused on brittle materials above all. The line in the figure above would be defined as:
![]() ,
,
which leads to the following formula:
 .
.
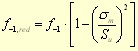
Morrow No.1 (with true fracture stress)
Dowling [Dow04] refers to this method as being suitable for general ductile materials. The line in the figure above would be defined as:
![]() ,
,
which results in the following formula:
 .
.
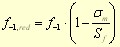
Morrow No.2 (with fatigue strength coefficient)
Dowling [Dow04] recommends this method as better for steels in comparison to the previous one and remarks that it is not suitable for aluminum alloys.
![]() ,
,
which results in the following formula:
 .
.
SWT
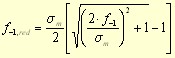
This type of the MSE is used in the SWT unixial fatigue calculation method. The previously mentioned formula for derivation of the equivalent load can be rewritten for our purposes to:
![]() .
.
The quadratic equation has only one positive root:
Bergmann
A similar conversion as by the SWT formula is necessary when focusing on allowable load amplitude:
![]() .
.
Again, there is only one positive root of this formula:

© PragTic, 2007
This help file has been generated by the freeware version of HelpNDoc